Generate Report
You can view all events that occurred in BioStar X or just the alarm history. You can filter and generate custom reports according to user-defined conditions.
Click Data or select Data from the shortcut list at the top left of the screen on the Launcher page.
View all events
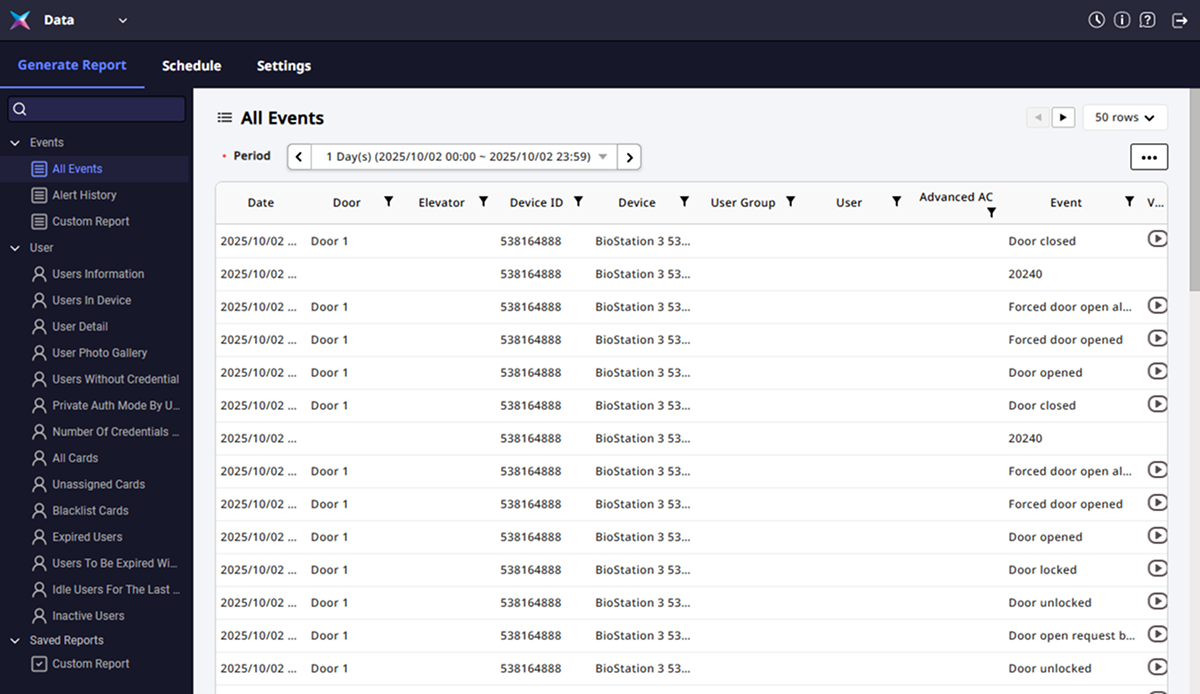
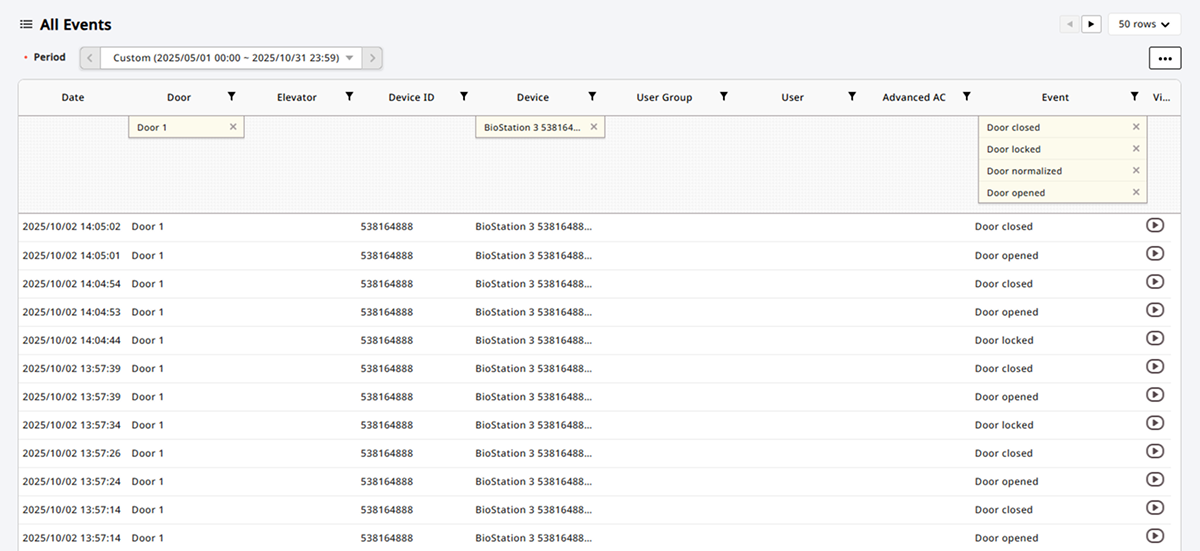
You can view all events that occurred in BioStar X. Click Events → All Events on the left sidebar of the screen.
-
To check the previous or next page from the listed results, click or at the top right of the screen.
-
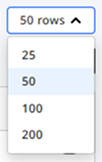
To change the number of rows displayed in the list, click the dropdown menu at the top right of the screen and select your desired value. You can select from a minimum of 25 rows to a maximum of 200 rows.
Set period
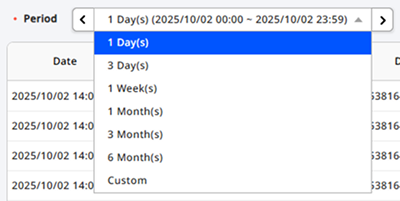
You can set the desired period in the Period option at the top left of the screen. Click the date area.
-
You can select predefined periods from today ranging from the 1st to 6 months. The events that occurred during the selected period will be automatically displayed in the list.
-
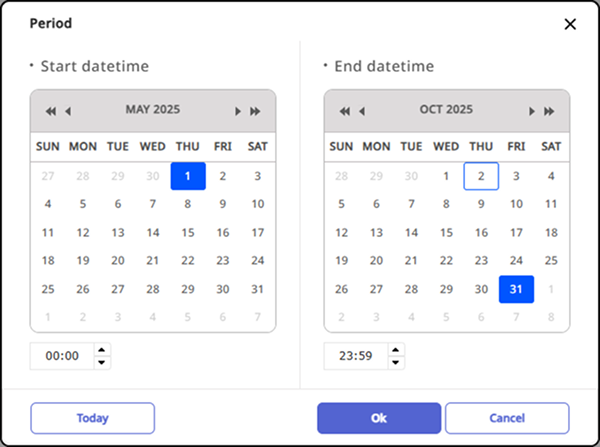
By selecting User Defined, you can also manually set your desired period. When the period selection window appears, set the start date, end date, and time, then click Ok. The events that occurred during the set period will automatically appear in the list.
 Info
InfoTo select today's date, click Today.
Set query conditions
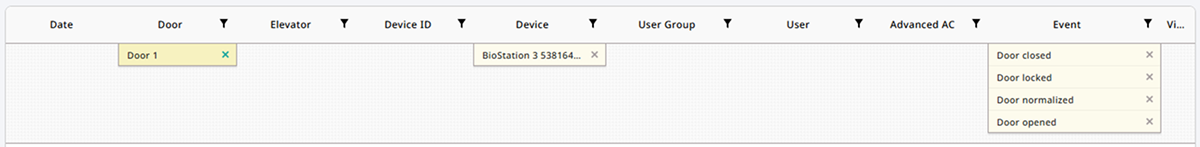
You can filter the list by setting your desired conditions in the header section of the query list. You can set conditions for all items except for dates.
-
In the header section of the event list, click the button for the desired column.
-
When the filter condition window appears, select your desired items.
-
Once your selections are complete, click the Add Condition button.
Only events matching the selected conditions will be displayed in the list.
Clear query conditions
To clear the set query conditions, click the button in the conditions set below the header section. The set conditions will be cleared, and all events will be displayed in the list again.
Check event video
If a camera is connected to a device where a specific event occurred in the event list, an View column will show the icon for that event. By clicking the icon, you can view the video at the time the event occurred through a pop-up window.

-
If you have connected more than one camera in the camera rule settings, it will play the video from the first camera. For more information on setting up camera rules, see Set Video Rules.
-
This feature is available with additional options on the Advanced license or higher. For more information on licensing policies, see License Policy.
-
For more information on linking cameras and doors, see Set Video Rules.
Export to CSV
You can export the queried event list as a CSV file. Click → CSV Export at the top right of the screen. You can download the CSV file to your PC.
The name format of the CSV file is Report_YYYYMMDD_hash.csv. (For example, Report_20251002_94a85b7519664378b4b39b879f1e81b7.csv)
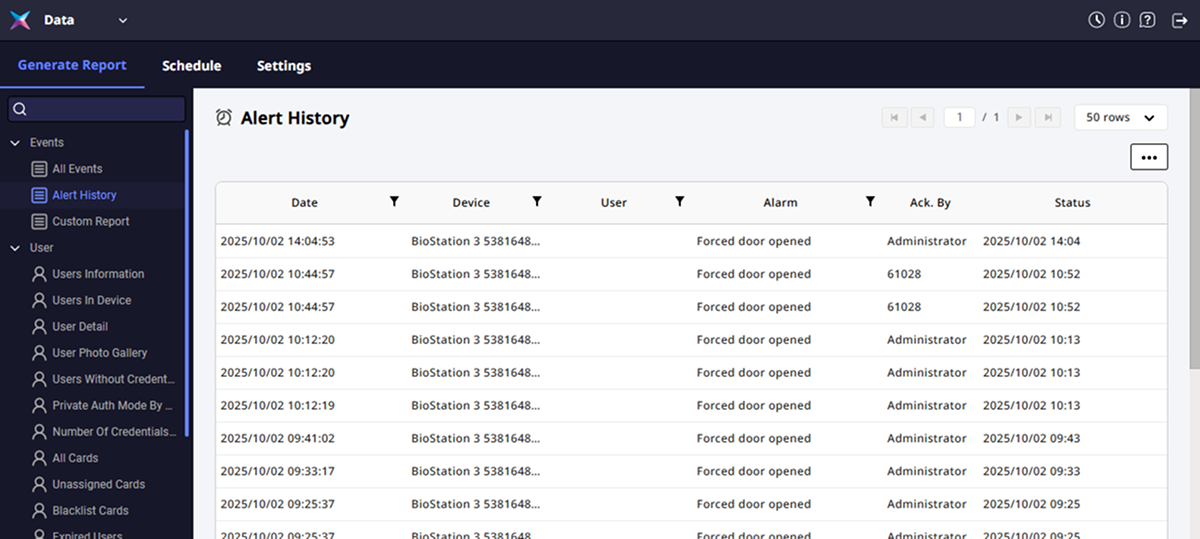
View alarm history
You can only view alarm (alert) history. Click Events → Alert History on the left sidebar of the screen.
-
To check the previous or next page from the listed results, click or at the top right of the screen.
-
To go to the first or last page of the queried list, click or at the top right of the screen.
-
To change the number of rows displayed in the list, click the dropdown menu at the top right of the screen and select your desired value. You can select from a minimum of 25 rows to a maximum of 200 rows.
For more information on viewing alarm (alert) events in event monitoring, see Monitor Event.
Set period
You can set the desired period and query the alarm history that occurred during that period. In the Date column of the queried list, click the button. When the period selection window appears, set the start date, end date, and time, then click Ok. The events that occurred during the set period will automatically appear in the list.
To select today's date, click Today.
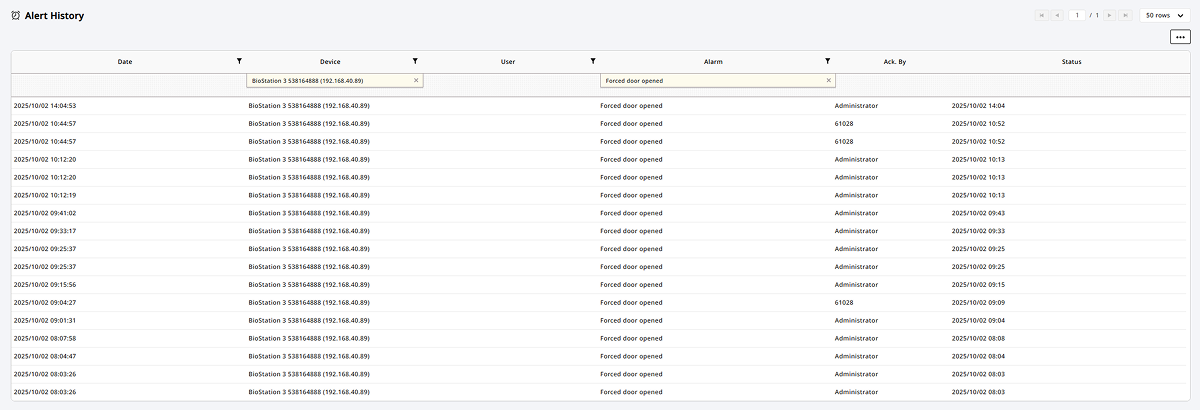
Set query conditions
You can filter the list by setting your desired conditions in the header section of the query list. You can set conditions for all items except for dates.
-
In the header section of the event list, click the button for the desired column.
-
When the filter condition window appears, select your desired items.
-
Once your selections are complete, click the Add Condition button.
Only events matching the selected conditions will be displayed in the list.
Clear query conditions
To clear the set query conditions, click the button in the conditions set below the header section. The set conditions will be cleared, and all events will be displayed in the list again.

User report query
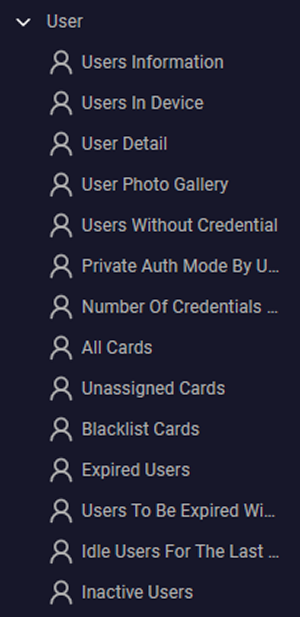
You can select user-related templates to generate reports. In the left sidebar of the screen, click the desired template under User.
-
Users Information: You can view detailed user information in a list format.
-
Users In Device: You can view information of users registered to the device.
-
User Detail: You can view detailed user information in a card format.
-
User Photo Gallery: You can view user profile pictures in a gallery format.
-
Users Without Credential: You can view users who have not set credentials.
-
Private Auth Mode By User: You can view user-specific private authentication mode settings.
-
Number Of Credentials By User: You can view the number of credentials set for the user.
-
All Cards: You can view users based on enrolled cards.
-
Unassigned Cards: You can view cards that have not been assigned to users.
-
Blacklist Cards: You can view disabled cards.
-
Expired Users: You can view users whose expiration date has passed.
-
Users To Be Expired Within X Days: You can view users whose expiration date is approaching within N days. You can directly input the number of days before generating the report.
-
Idle users for the last N months: You can view users who have had no access records for the past N months. You can directly input the number of months before generating the report.
-
Inactive Users: You can view inactive users.
-
The generated report can be saved under Saved Reports. Click the Save Report button at the top left of the report.
-
For more information on managing reports, see #report-management.
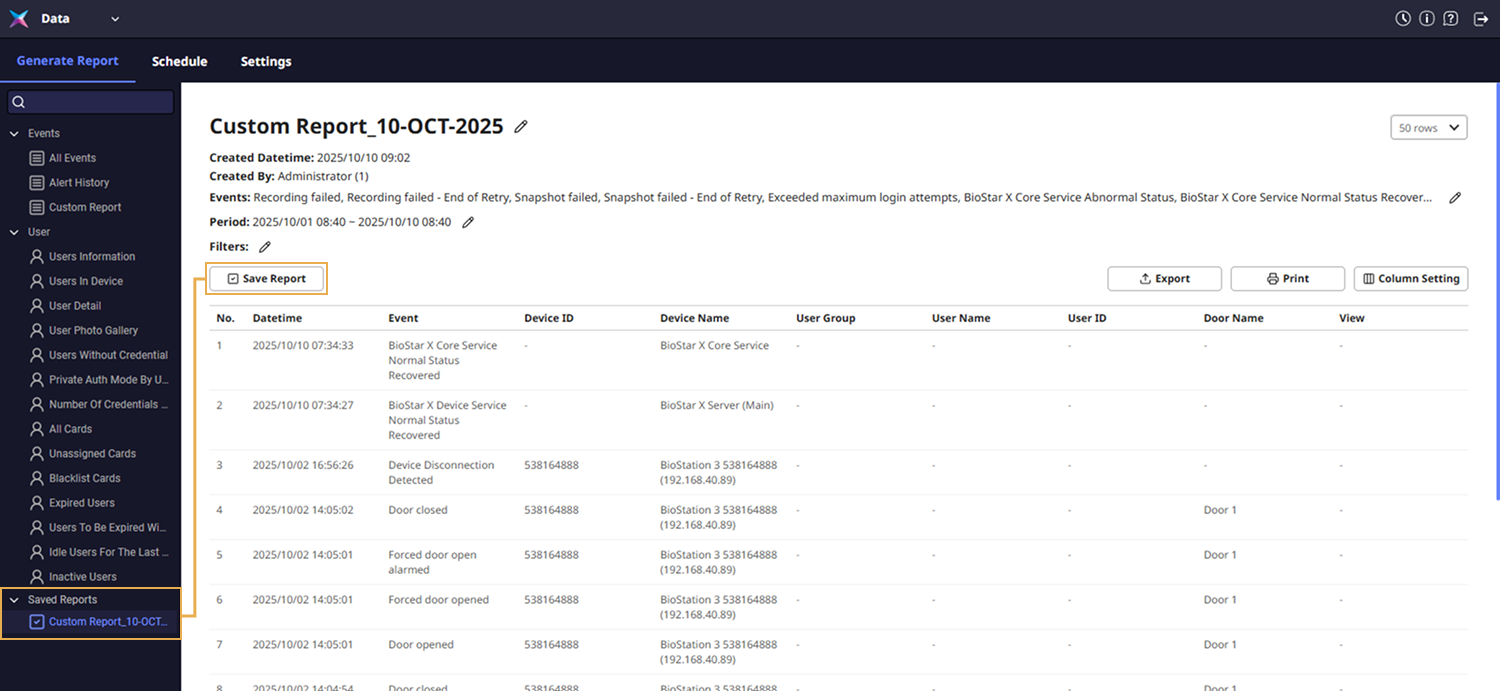
Generate custom report
You can filter and generate custom reports according to your desired conditions. The generated report can be saved as a template for convenient use when generating reports with the same conditions in the future.
-
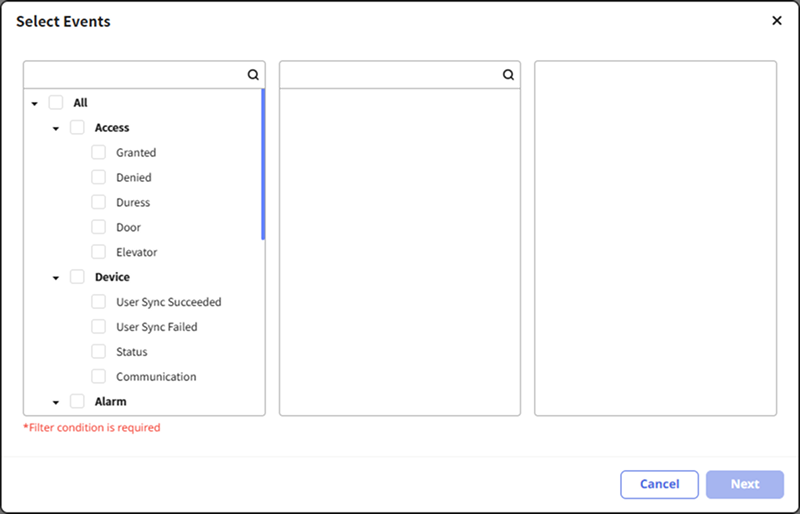
Click Events → Custom Report on the left sidebar of the screen.
-
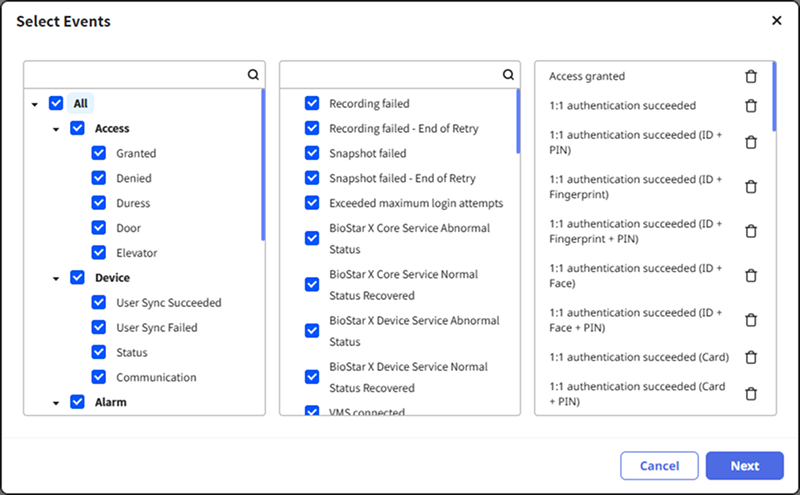
In the Select Events window, select the desired events.
-
Once you have completed your desired event selection, click the Next button.
-
In the search () input field, you can search for desired items.
-
By clicking the button in the rightmost list, you can exclude the selected items.
-
-
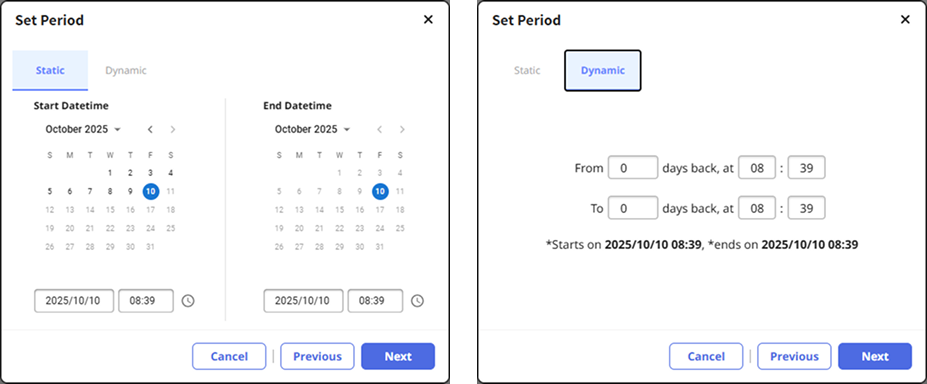
Set the query period and click the Next button.
-
Static: You can set a specific date and time to set the query period.
-
Dynamic: You can set the start date, end date, and time based on today. It is useful when generating reports for a specific period iteratively.
-
-
You can set conditions based on users, doors, and devices, either grouped or individually.
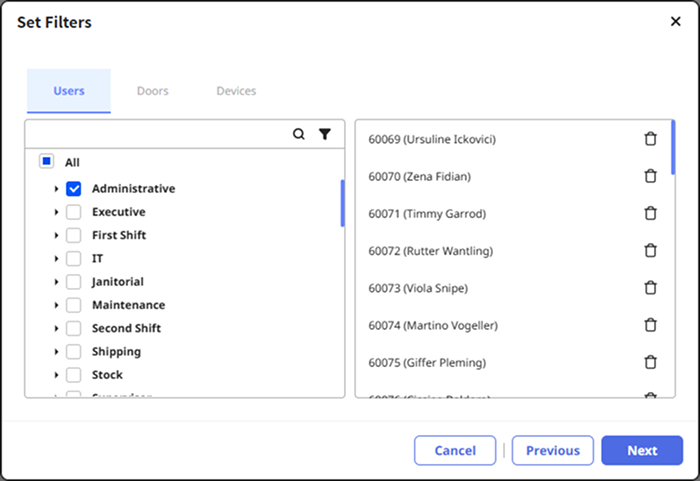
- By clicking the button in the right list, you can exclude the selected items.
-
Select your desired conditions and click the Next button.
-
In the column settings window, select the columns to be displayed in the report.
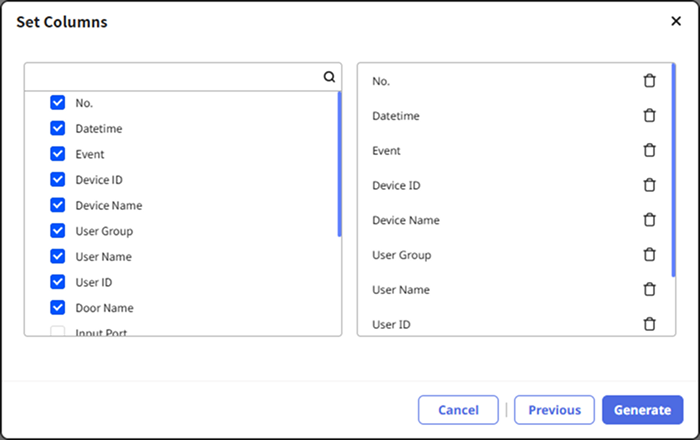
-
Once you have finished selecting your desired columns, click the Generate button.
Complete the creation of the custom report.
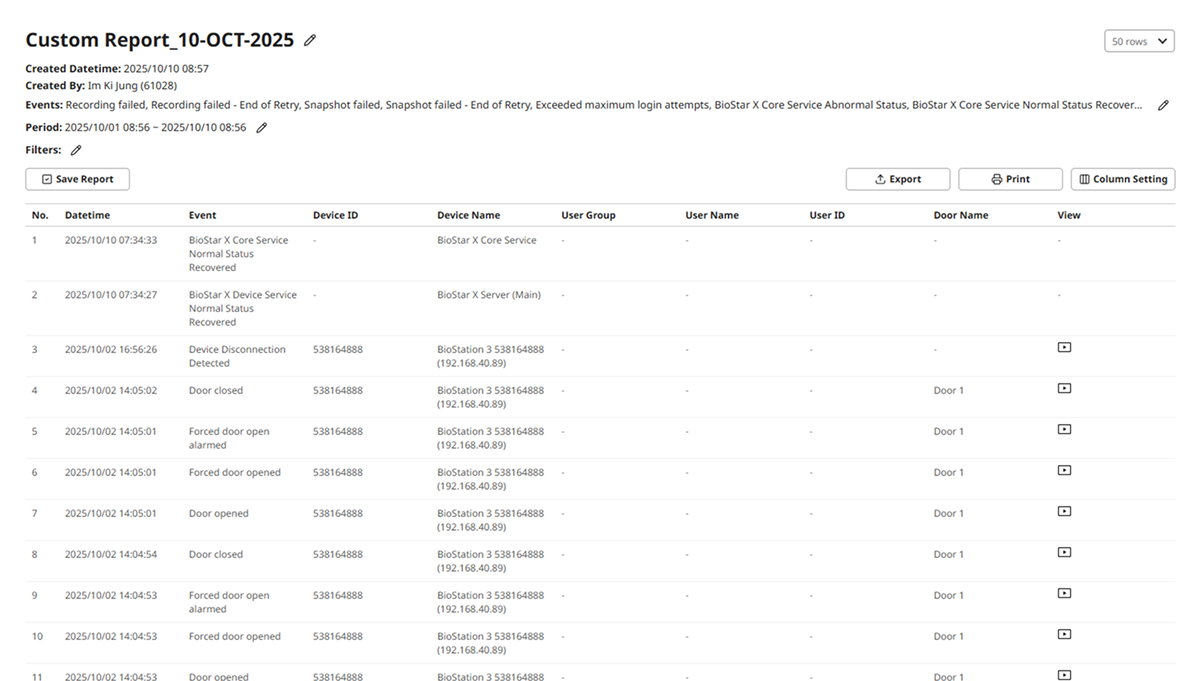
-
To modify the report title, event items, period, and filter conditions, click the button at the top of the report.
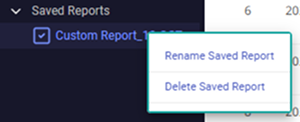
-
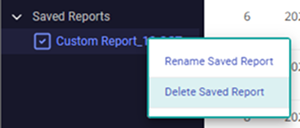
The report title can also be changed under Saved Reports in the left sidebar of the screen. Select the custom report for which you want to change the title and right-click. Select Rename Saved Report from the pop-up menu.
-
For more information on managing reports, see #report-management.
Report management
Report Save
To save the generated report as a template, click the Save Report button. Saved reports can be viewed under Saved Reports in the left sidebar of the screen.
Save report file
To export the report as a PDF or CSV file, click the Export button. When the Export Report window appears, set each item and click the Export button.
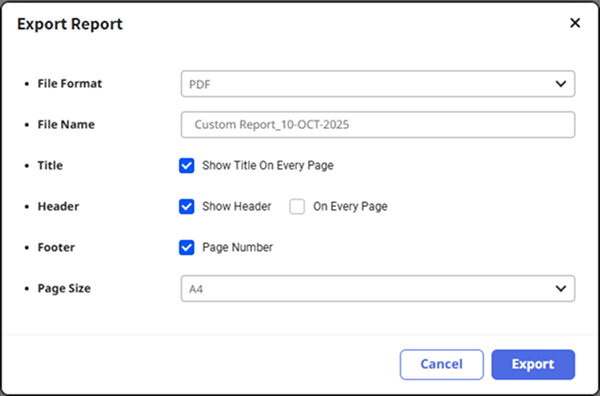
Export Reason is optional. View Export Reason records under Settings → System → Audit Trail.
Print report
To print the report using a printer connected to your PC, click the Print button. When the Print Report window appears, set each item and click the Print button.
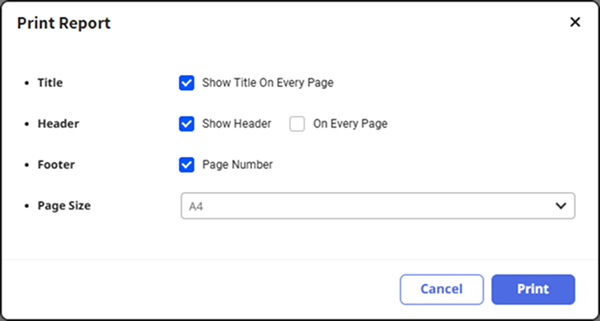
The print preview screen will appear in a new tab of your web browser. Click the print button at the top right of the screen to start printing.
Export Reason is optional. View Export Reason records under Settings → System → Audit Trail.
Delete report
To delete a saved report, select the report to be deleted under Saved Reports in the left sidebar and right-click. Select Delete Saved Report from the pop-up menu.
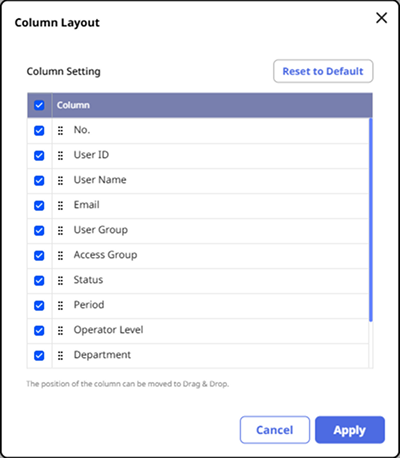
Set columns
You can change the column settings displayed in the report. Through column settings, you can select the columns to be displayed or change the order of the columns.
-
Click the Set Columns button at the top right of the report.
-
When the Column Layout window appears, select or deselect the desired columns.
-
To change the order of the columns, click and drag the desired column to change its position.
-
To save the settings, click the Apply button.
-
To reset the column layout settings, click the Default Column button.
-
Depending on the generated report, the columns that can be selected or deselected may vary.